- Database Reporting
Custom Reporting & Dashboard Development Cost in the UK in 2026
12 Apr, 2026
Custom dashboards and automated reporting that turn scattered spreadsheets and disconnected systems into a single, reliable source of truth for your business.
We design reporting dashboards around the decisions your team actually makes, not a generic template - so the numbers that matter to you are always front and centre.
We connect to the systems you already run rather than forcing a costly migration, pulling data together into reports that update without manual copy-and-paste.
Every database reporting and analytics project is quoted as a fixed price after a free consultation, so you know the cost before any work begins.
Most businesses don't have a data problem - they have a data-in-too-many-places problem. Sales figures sit in one system, finance in another, and someone still spends a chunk of every month rebuilding the same spreadsheet by hand. We build database reporting and analytics tools that pull your existing information into one place, present it clearly, and refresh themselves, so the report on the screen at your next meeting is the same one everyone can trust. We handle the data connections, the cleansing, the dashboard design and the ongoing support, delivered remotely with on-site visits around Bromley where they're genuinely useful.
Bromley is London's largest borough by area, and its business community is a mature, established one - built around professional and financial services, with a town centre that remains the primary commercial hub for retail and office space across the borough. That mix means a wide spread of reporting needs sitting side by side: a financial services firm needing month-end figures signed off on time, a retail business needing to see stock and sales across several sites, a healthcare provider needing patient and scheduling data reported accurately, and the aviation businesses clustered around Biggin Hill Airport needing operational reporting that keeps pace with a demanding schedule. Wherever your business sits within that mix, the underlying problem tends to be the same one: the data exists, but nobody has time to pull it together every week.
Away from the town centre, Orpington and Beckenham each support their own clusters of professional and retail businesses, giving Bromley a spread of established firms rather than a single concentrated business district. That spread is exactly where database reporting earns its keep - a dashboard that pulls figures from more than one site or system into a single view saves real time for a business with people working across different parts of the borough, rather than everyone maintaining their own version of the numbers.
Bromley South station is around 25 minutes by train from London Bridge, which keeps us close enough to visit in person when a project genuinely needs it - installing on-site data connections, sitting with your finance team to map out a report, or training staff to use a new dashboard. Most of the day-to-day work, from building reports to keeping them running, is handled remotely, in line with how we deliver database reporting projects for SMEs across London and the wider UK.
We start by understanding what you already run and where your data actually lives, then build connections and reports around that - rather than asking you to rip out and replace working systems just to get a dashboard.
Once a dashboard or reporting system is live, we stay involved - fixing connections if a source system changes, adjusting reports as your business evolves, and answering questions when your team is getting used to something new.
From first conversation to a working dashboard - our process keeps things simple.
We learn where your data lives, what it currently takes to produce a report, and what decisions the finished dashboard needs to support.
We map out which figures matter, how they should be presented, and how often they need to refresh, then agree the scope and a fixed price.
We connect to your systems, clean up the underlying data, and build the dashboard or reports on secure, reliable cloud infrastructure.
Your reporting goes live, your team is shown how to use it, and we remain on hand for adjustments and ongoing support afterwards.
We build reporting and analytics around the systems you already have - we don't insist on ripping out working software just to get a dashboard on screen.
Every project is quoted as a fixed price after a free consultation, so you know the full cost before we start and there are no hourly-billing surprises along the way.
Your data is handled securely throughout, from the first connection to the finished report, and we're straightforward about what we can and can't do with the systems you run.
Reports and dashboards are built to run reliably on secure cloud infrastructure, so the figures your team relies on are there when they need them.
We're based in the City of London and cover Bromley and the wider capital for on-site visits, with most day-to-day support handled remotely.
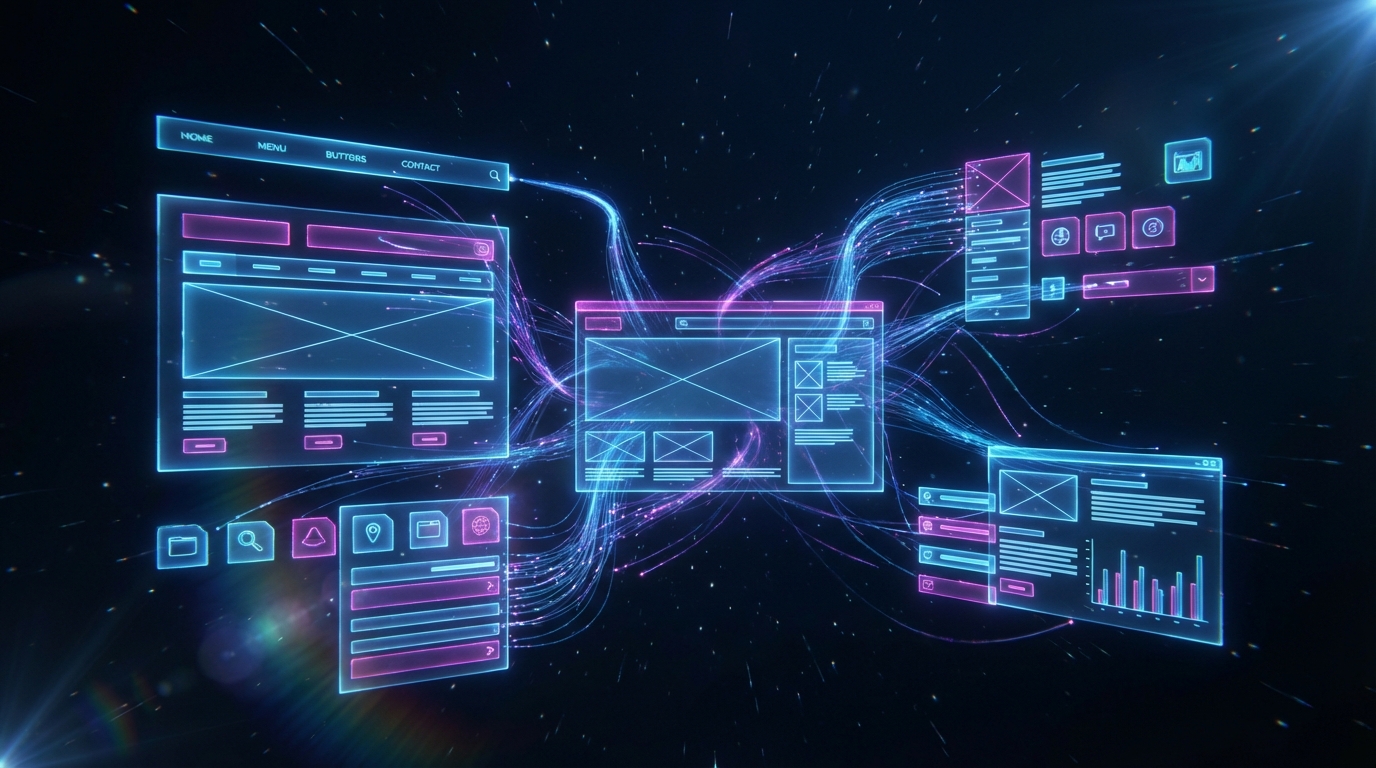
We build reporting tools that get used, not dashboards that get opened once and forgotten. Here's what sets our approach apart.
We start from what your business actually needs to see, then build the connections and reports to match - rather than fitting your business into an off-the-shelf dashboard.
We connect to the software you already run rather than pushing a costly migration, so your team keeps working the way it already does while the reporting improves around it.
Data connections and reports are built with security in mind throughout, and we're straightforward about exactly what access a report or dashboard needs and why.
We explain what a report shows and why in plain English, so your team can trust and use it, not just have it presented once and left alone.
Most of the build and support happens remotely, with on-site visits around Bromley and the rest of London when a project genuinely needs hands on the ground.
Every dashboard is designed around the decisions it actually needs to support, so the figures that matter most are always the easiest ones to find.
You own the reports, the dashboard and the underlying data connections we build. We work on open, standards-based technology, so you're never tied to us to keep it running.
We don't disappear once a dashboard goes live. If a source system changes or a report needs adjusting, we're on hand to fix it.
Every project is quoted as a fixed price after a free consultation, so there's no hourly billing and no surprise invoices once the work is underway.
Businesses across Bromley depend on properly configured technology systems to keep reporting and dashboard tools running reliably, particularly where professional services, financial services, retail, healthcare, aviation and education firms are all relying on accurate, up-to-date figures. A dashboard is only as good as the connection and infrastructure behind it, which is why database reporting projects benefit from being built on secure, well-maintained cloud infrastructure alongside sound day-to-day IT management.
Bromley is London's largest borough by area, and its business base reflects that scale - a mature, established community weighted towards professional and financial services, with the town centre acting as the primary commercial hub for retail and office space across the borough. The Glades shopping centre anchors the town centre's retail offer, drawing footfall alongside the surrounding office and professional-services district.
A borough of distinct business clusters: Beyond the town centre, Orpington and Beckenham each support their own established business communities, giving Bromley several commercial centres rather than one. Biggin Hill, in the south of the borough, is home to Biggin Hill Airport and the aviation services built up around it - a distinctive part of the local economy alongside the borough's professional services, retail, healthcare and education sectors.
Getting here: We cover Bromley and the wider borough for installs, data connections and on-site visits, reaching Bromley South station in around 25 minutes by train from London Bridge. Most database reporting and analytics work - building dashboards, connecting systems, keeping reports running - is handled remotely, with site visits booked when a project genuinely needs someone on the ground.
Borough
London's largest borough by area, anchored by Bromley town centre and The Glades shopping centre, with Orpington, Beckenham and Biggin Hill - home to Biggin Hill Airport - forming distinct business clusters of their own. It's the everyday geography a reporting or dashboard project needs to work across.
database reporting and analytics
Custom dashboards and automated reporting that connect to the systems your business already runs, turning scattered data into a single, trustworthy view for decision-making.
database reporting Bromley
Serving Bromley's professional services, financial services, retail, healthcare, aviation and education businesses with reporting and analytics delivered remotely, with on-site visits when a project needs them.
Got questions? We've answered the most common ones below. If you need more detail, get in touch.
It varies by business, but typically covers connecting to the systems that hold your data, cleaning and structuring that data, and building dashboards or scheduled reports around the figures you need to see. We scope it exactly during the free consultation.
Usually not. We build reporting and dashboards around the systems you already run wherever we can, rather than asking you to migrate to new software just to get better visibility of your data.
It depends on how many systems need connecting and how complex the reporting is. We agree a timeline along with the fixed price after the free consultation, once we understand the scope.
Where the underlying systems support it, yes - reports refresh on a schedule you set, rather than needing someone to manually rebuild them. Where a source system can't feed data automatically, we're upfront about that during scoping.
Yes, data connections and reports are built with security in mind throughout, and we're always clear about exactly what access a report or dashboard needs and why, before we connect to anything.
No, dashboards are designed to be read at a glance by non-technical staff, and we walk your team through how to use whatever we build before we consider a project finished.
It's quoted as a fixed price after a free consultation, based on how many systems you need connected and how much reporting and dashboard work is involved, so there are no hourly-rate surprises.
Yes, we remain on hand after launch to adjust reports as your business changes and to fix connections if a source system is updated or replaced.
Limited time offer - valid until 31/05/2026
We believe that communication is key to any successful partnership. Submit your details and one of our friendly team members will be in touch with you shortly.
Submit your details and one of our friendly team members will be in touch with you shortly
Powered by industry-leading technologies including SolarWinds, Cloudflare, BitDefender, AWS, Microsoft Azure, and Cisco Meraki to deliver secure, scalable, and reliable IT solutions.


Powered by industry-leading technologies including SolarWinds, Cloudflare, BitDefender, AWS, Microsoft Azure, and Cisco Meraki to deliver secure, scalable, and reliable IT solutions.
21 Sep, 2026
Somewhere between fifteen and sixty staff, almost every UK business has the same argument. The IT has stopped being something the office manager can absorb...
20 Sep, 2026
Copilot ROI measurement is the conversation that arrives about ten months after the licences do. The rollout went well enough, people say they like it, and...
19 Sep, 2026
The penetration test process is opaque to most of the people who commission it. A UK business signs off a quote, agrees some dates, and then waits. Somewhere...