- Database Reporting
Custom Reporting & Dashboard Development Cost in the UK in 2026
12 Apr, 2026
Custom dashboards and reporting that turn scattered spreadsheets, CRMs and product data into one clear, decision-ready view - built for Islington's tech, agency and SaaS businesses.
We start with the numbers that actually drive your decisions, then build the dashboard around them - not a generic template borrowed from somebody else's business.
Product data, your CRM, finance figures and spreadsheets pulled into a single connected dashboard, so nobody has to log into five different tools before a Monday meeting.
Refresh cadence, layout and chart choice are all shaped around how your team actually uses the numbers, not a default setting left over from a template.
Most growing businesses reach a point where their data has outgrown the tools tracking it. A spreadsheet updated by hand once a week, a CRM report that only shows part of the picture, an analytics login nobody checks because it doesn't answer the actual question - these are all signs that reporting has fallen behind the business it's meant to serve. We build custom database reporting and analytics that pulls the numbers that matter from wherever they currently live - a CRM, a product database, an accounting system, a spreadsheet - into a single, live view built around your specific KPIs rather than a generic dashboard template.
This tends to suit different teams for different reasons. A product team wants usage and retention figures without exporting CSVs every week. An agency wants clean, client-ready reporting it doesn't have to assemble by hand each month. A founder preparing for a board meeting or investor update wants revenue, pipeline and burn on one screen, not scattered across four logins. Whatever the trigger, the approach is the same: understand what you're actually trying to decide, then build the reporting layer that answers it, scoped as a fixed-quote project after a free consultation rather than open-ended billing.
It's worth being upfront about what a dashboard can and can't do. It won't fix inconsistent or messy data at the source - if your CRM records are patchy or your tracking is incomplete, a good dashboard will surface that clearly rather than hide it, which is uncomfortable but useful. It also isn't a one-off deliverable; KPIs shift as a business grows, new data sources get added, and reporting that isn't maintained slowly drifts out of step with how the business actually runs. Treated as a living tool rather than a finished project, it earns its keep.
Islington sits at the heart of London's technology corridor, with the Angel and Old Street areas forming the southern gateway to Silicon Roundabout. The borough is home to hundreds of digital agencies, software firms and design studios, and its concentration of co-working spaces and incubators along City Road creates a continuous tech ecosystem linking straight through to the City. That density of tech startups, SaaS companies, digital agencies, design studios and venture-backed businesses means reporting needs here tend to look different from a typical high street business - product usage metrics, client campaign reporting, investor-ready revenue dashboards, and cross-platform data pulled from tools most teams already use day to day rather than paper records or till receipts. We build the reporting layer for exactly that kind of business.
Working with a tech startup, SaaS business or digital agency based near Silicon Roundabout or the Angel business district usually means the raw data already exists somewhere - a product database, a CRM, a billing platform, a campaign tool - it's just never been pulled into one place that answers the actual question a founder or account lead is asking. Co-working spaces and incubators along City Road host plenty of early-stage teams who have outgrown a shared spreadsheet but aren't yet ready to hire a data analyst. That's a specific, recognisable gap, and it's one we build custom dashboards to close, scoped to match the size of the business asking.
We're a City of London-headquartered digital agency, and Islington - around 10 minutes by Tube from Bank to Angel or Old Street - sits comfortably within reach for the occasional site visit a reporting project needs, such as a working session with your team or connecting a system that lives on-site. Most of the actual build, testing and data connection work happens remotely, which keeps turnaround fast and cost sensible for a startup or agency budget, with travel reserved for the moments it genuinely helps rather than billed as a matter of course.
Before any build work starts, we work out which numbers genuinely drive decisions in your business - the metrics a founder checks before a board call, the figures an account lead needs before a client meeting - so the dashboard surfaces what matters rather than what happened to be easiest to export.
Islington's tech and agency businesses typically run on several tools at once - a CRM, a product database, a billing platform, an ad account. We connect the ones relevant to your KPIs into a single dashboard, so nobody has to log into five systems and reconcile numbers by hand before a decision gets made.
From your current reporting mess to a single, live dashboard.
We map your current data sources, existing reporting and the KPIs that actually drive decisions in your business.
We design the dashboard layout and visualisations around how the data will actually be used, not a generic template.
We connect your CRM, product database, finance system or spreadsheets, and build the live reporting layer.
Your dashboard goes live with ongoing support, and we refine it as your KPIs and data sources evolve.
We build reporting around the metrics that genuinely drive your decisions, not a generic template of vanity numbers borrowed from someone else's dashboard.
Every project is genuinely cross-platform where it needs to be, pulling your CRM, product data, finance figures or spreadsheets into one connected, live view.
We scope refresh cadence to how the data is actually used, so a fast-moving SaaS or agency team gets real-time reporting where it matters without over-engineering the rest.
As a database reporting specialist working alongside web development and custom AI teams in-house, we can connect data sources that would otherwise need a separate developer to integrate.
We support Islington's tech and agency businesses directly and deliver the same process and standard of build remotely across the rest of London and the UK.
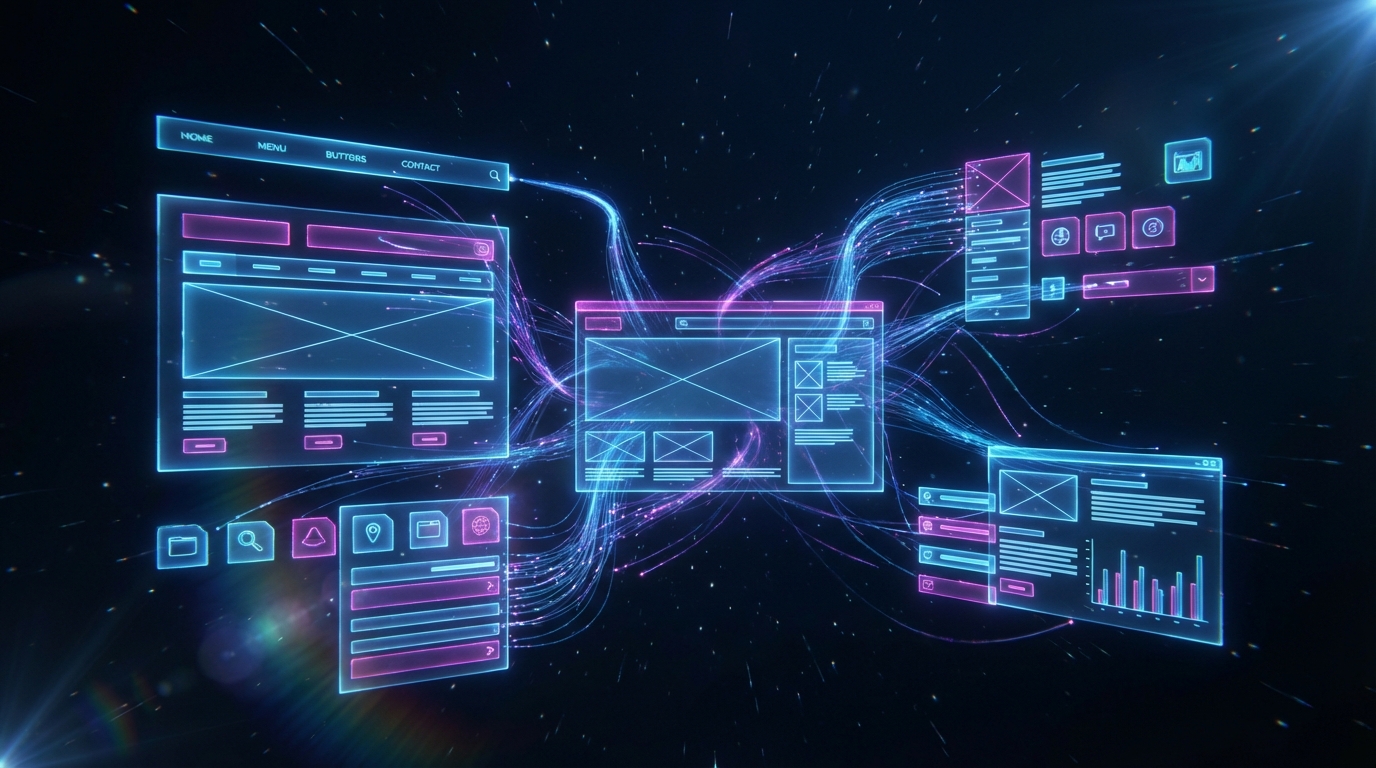
We build reporting that gets used, not dashboards that get built once and forgotten. Here's what sets us apart.
We start with what genuinely drives decisions in your business, not a generic template of metrics that don't apply.
CRM, product data, finance and spreadsheets connected into one view, not siloed reports across five separate logins.
We size the refresh rate to how the data is actually used, rather than defaulting everything to real time regardless of need.
You'll never chase a ticket queue. Every client gets a named contact throughout the build and beyond.
We design for at-a-glance readability, choosing the right chart type and layout rather than defaulting to a busy generic template.
Because we build web applications and AI workflows too, we can connect data sources that would otherwise need a separate developer.
You own the dashboard, the code and the data connections - we build on open, standards-based technology throughout.
Dashboards evolve as KPIs and data sources change, and we refine yours as your business does, not just at launch.
We scope every project individually around your data sources and complexity, with a clear quote rather than open-ended billing.
Islington's tech startups, SaaS companies and digital agencies depend on properly connected systems that keep product dashboards, client reporting and internal metrics accurate and available when they're needed - often at short notice before a board meeting or client call. The borough's dense cluster of co-working spaces and incubators along City Road means many teams are already cloud-first by default, which makes connecting a CRM, billing platform or product database into a live dashboard straightforward once the right reporting layer is built around it.
Islington sits at the heart of London's technology corridor, where Angel and Old Street form the southern gateway to Silicon Roundabout, London's dense, long-established cluster of tech and digital businesses. Hundreds of digital agencies, software firms and design studios are based here, alongside a steady flow of SaaS companies and venture capital activity drawn by that concentration of talent and ideas.
A continuous tech ecosystem: Co-working spaces and incubators along City Road link Islington's tech and creative businesses straight through to the City, giving early-stage startups and established agencies alike easy access to clients, investors and collaborators without leaving the borough. It's an environment where a founder can walk between a pitch meeting and a client review in the time it takes to cross Old Street roundabout.
Getting here: We reach Islington in around 10 minutes by Tube from Bank to Angel or Old Street. Most reporting and dashboard work is handled remotely, with site visits booked for the moments - a workshop, a system connection - that genuinely need someone in the room.
Borough
Silicon Roundabout and the Angel business district mark Islington's tech core, with hundreds of digital agencies, SaaS companies and design studios clustered along City Road. It's the everyday geography of the borough's fast-moving tech scene, and where dashboards and reporting need to keep pace.
database reporting and analytics
Custom dashboards, KPI reporting and cross-platform data integration built around the metrics that actually drive your decisions, scoped as a fixed-quote project after a free consultation.
database reporting Islington
Serving Islington's tech startups, SaaS companies, digital agencies and design studios with live dashboards and reporting, delivered remotely from our City of London base with on-site visits where needed.
Got questions about database reporting & analytics in Islington? We've answered the most common ones below.
A custom dashboard connecting the data sources relevant to your KPIs - typically a CRM, product database, finance system or spreadsheets - designed around the specific metrics your business actually tracks, not a generic template.
Cost depends on how many data sources need connecting and how complex the reporting needs to be. We scope every project individually after a free consultation and provide a clear, fixed quote before any work begins.
Yes, connecting the systems relevant to your KPIs into a single live dashboard is the core of what we build, whatever combination of tools your business currently runs on.
Yes, where it genuinely helps. We size the refresh cadence to how the data is actually used, so fast-moving teams get real-time reporting without over-engineering dashboards that only need a daily or weekly update.
Yes, we work with tech startups, SaaS companies, digital agencies and design studios based in Islington directly, and deliver the same process and standard of build remotely across the rest of London and the UK.
No, dashboards are designed for at-a-glance readability by the people who'll actually use them day to day - a founder, an account lead, an operations manager - not just a data specialist.
Yes, migrating manual, spreadsheet-based reporting into a single live dashboard is one of the most common projects we take on, particularly for growing teams that have outgrown a shared spreadsheet.
Yes, we provide ongoing support and refine the dashboard as your KPIs and data sources evolve, rather than treating launch as the end of the project.
Limited time offer - valid until 31/05/2026
We believe that communication is key to any successful partnership. Submit your details and one of our friendly team members will be in touch with you shortly.
Submit your details and one of our friendly team members will be in touch with you shortly
Powered by industry-leading technologies including SolarWinds, Cloudflare, BitDefender, AWS, Microsoft Azure, and Cisco Meraki to deliver secure, scalable, and reliable IT solutions.


Powered by industry-leading technologies including SolarWinds, Cloudflare, BitDefender, AWS, Microsoft Azure, and Cisco Meraki to deliver secure, scalable, and reliable IT solutions.
21 Sep, 2026
Somewhere between fifteen and sixty staff, almost every UK business has the same argument. The IT has stopped being something the office manager can absorb...
20 Sep, 2026
Copilot ROI measurement is the conversation that arrives about ten months after the licences do. The rollout went well enough, people say they like it, and...
19 Sep, 2026
The penetration test process is opaque to most of the people who commission it. A UK business signs off a quote, agrees some dates, and then waits. Somewhere...