Your business network is the circulatory system of your organisation. When it is healthy, data flows smoothly, applications respond instantly, and your team works productively without giving the network a second thought. When it is not healthy, everything suffers — video calls freeze, files take minutes to open, cloud applications crawl, and staff productivity plummets. For UK businesses using Cisco Meraki networking equipment, the Meraki dashboard provides an extraordinarily powerful suite of health monitoring tools that can keep your network in peak condition — if you know how to use them effectively.
Cisco Meraki has become the networking platform of choice for thousands of UK SMEs and mid-market businesses. Its cloud-managed approach — where every access point, switch, and security appliance is configured and monitored through a single web-based dashboard — eliminates the complexity of traditional networking whilst providing enterprise-grade capabilities. But many businesses only scratch the surface of what the Meraki dashboard offers, particularly when it comes to health monitoring and proactive network management.
This guide explores the full spectrum of Meraki health monitoring capabilities, showing you how to leverage these tools to prevent network problems before they impact your business.
Understanding the Meraki Health Dashboard
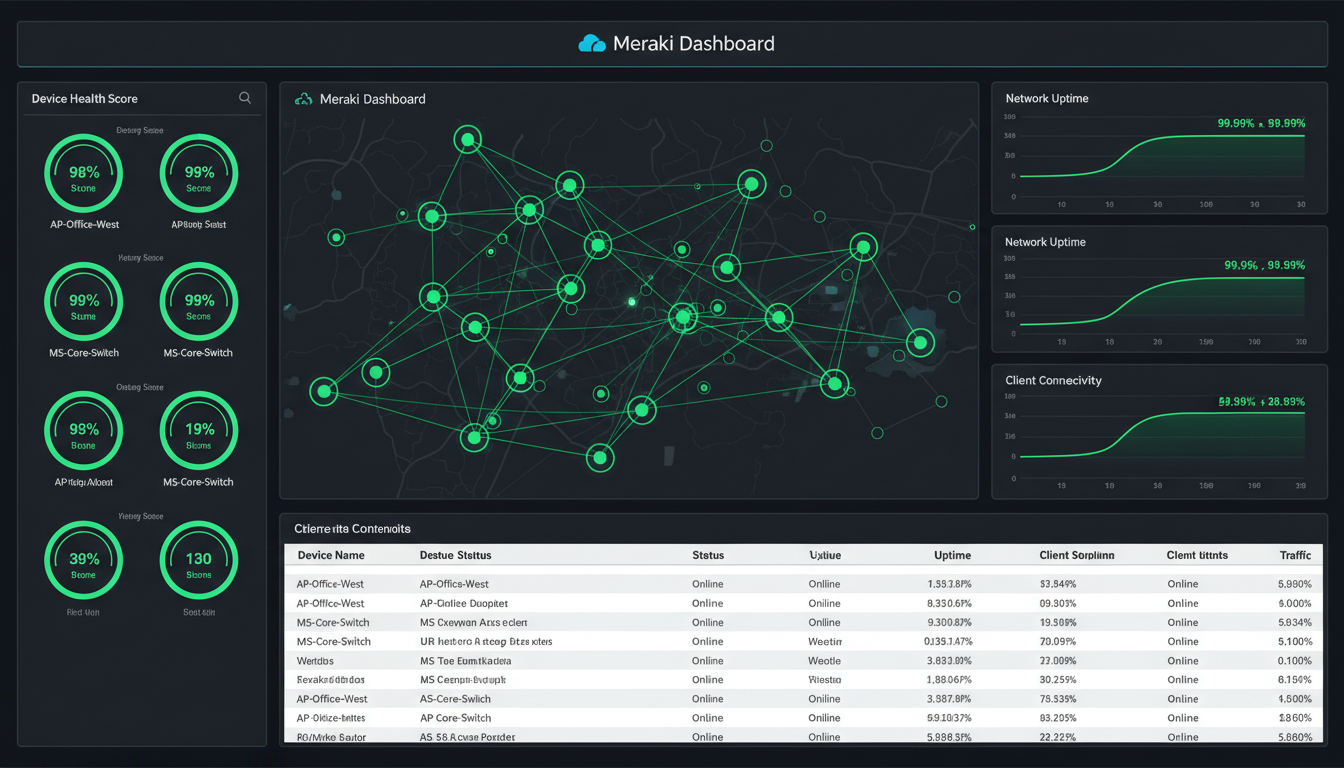
The Meraki dashboard is the central nervous system of your Meraki network. Accessible from any web browser, it provides real-time visibility into every device, every client, and every connection on your network. The health monitoring features are woven throughout the dashboard, but the primary health overview is found in the Organisation Summary and the individual network health pages.
When you log into the Meraki dashboard and navigate to a network, the overview page immediately presents a health summary showing the status of your wireless access points, switches, security appliances, and any other Meraki devices. Green means healthy, yellow indicates a warning, and red signals a problem that needs immediate attention. But these traffic-light indicators are just the beginning — the real power lies in the detailed diagnostics available behind each summary.
It is worth noting that the Meraki dashboard has evolved significantly in recent years, with Cisco investing heavily in AI-driven insights and predictive analytics. The platform now processes telemetry data from over 4.5 million networks globally, and the machine learning models trained on this vast dataset can identify patterns and anomalies that would be invisible to human operators. For UK businesses, this means that even a relatively small Meraki deployment benefits from intelligence gathered across millions of networks worldwide — a capability that was previously available only to the largest enterprises with dedicated network operations centres.
Meraki monitors network health across several distinct categories. Wireless Health tracks access point performance, client connectivity success rates, roaming efficiency, and RF environment quality. Switch Health monitors port utilisation, PoE delivery, spanning tree status, and uplink connectivity. WAN Health tracks internet connection performance, latency, packet loss, and failover status. Application Health monitors the performance of key applications traversing your network, identifying slowdowns caused by the network versus the application itself. Together, these categories provide a holistic view of your network operational status.
Wireless Health Monitoring
For most UK businesses, wireless connectivity is the primary way staff connect to the network. A poor wireless experience directly impacts productivity, meeting quality, and staff satisfaction. The Meraki wireless health tools give you deep visibility into every aspect of your wireless network performance.
Connection Health
The wireless connection health page shows the success rate of client connections over time. It breaks down the connection process into stages — association, authentication, DHCP, and DNS — showing where failures occur. If 15% of connections are failing at the DHCP stage, you know your DHCP server or scope is the problem, not your wireless configuration. This granular breakdown transforms troubleshooting from guesswork into targeted action.
In practice, connection health data is most valuable when reviewed over time rather than as a snapshot. A sudden drop in authentication success rates might indicate a certificate expiry or a change to your RADIUS server. A gradual decline in DHCP success might point to an address pool that is slowly being exhausted as more devices join the network. By reviewing connection health trends weekly, you can identify and resolve emerging issues before they cause visible disruption to your users — turning reactive support into proactive maintenance.
Channel Utilisation
In busy office environments, particularly in UK city centres like London, Manchester, Birmingham, or Edinburgh, Wi-Fi channel congestion is a major source of performance problems. Meraki monitors channel utilisation across all access points, showing you which channels are congested and which have capacity. The auto-channel feature automatically adjusts to minimise interference, but monitoring the data helps you identify persistent congestion that might require physical changes such as adding access points or repositioning existing ones.
Client Health Scores
Meraki assigns a health score to every wireless client based on their connection quality, throughput, and latency. You can quickly identify clients experiencing poor performance and drill down to understand why — is it a weak signal, channel congestion, an outdated driver, or a problem with the client device itself? This per-client visibility is invaluable when staff report connectivity issues, allowing you to diagnose and resolve problems in minutes rather than hours.
WAN and Uplink Health
Your internet connection is the lifeline that connects your business to cloud services, email, VoIP, and the wider world. The Meraki WAN health monitoring tools track the performance of your internet uplinks in real time, measuring latency, packet loss, and jitter — the three metrics that most directly impact user experience.
For businesses with dual internet connections (which we strongly recommend for any business-critical environment), Meraki monitors both links simultaneously and can automatically fail over to the backup connection if the primary link degrades or fails. The dashboard shows historical performance data for both links, making it easy to hold your ISP accountable if they are not delivering the service they promised.
In the UK, where many businesses rely on Openreach infrastructure for their primary connectivity, WAN health monitoring provides a particularly important function: evidence. When you experience degraded performance on a leased line or FTTP connection, having timestamped latency and packet loss data from your Meraki dashboard gives you concrete evidence to present to your ISP when raising a fault. Without this data, you are reliant on the provider running their own diagnostics — which invariably show no fault found. Meraki data shifts the burden of proof and frequently accelerates resolution times from days to hours.
| Metric | Good | Acceptable | Poor | Impact |
|---|---|---|---|---|
| Latency | < 30ms | 30-80ms | > 80ms | Application responsiveness, VoIP quality |
| Packet Loss | < 0.1% | 0.1-1% | > 1% | File transfers, video calls, reliability |
| Jitter | < 10ms | 10-30ms | > 30ms | Voice and video quality |
| Throughput | > 80% of plan | 50-80% | < 50% | Download/upload speeds, cloud performance |
Setting Up Alerts and Notifications
Monitoring is only valuable if you act on what it tells you. The Meraki alerting system sends notifications when predefined thresholds are crossed, ensuring that problems are addressed before they escalate. Configure alerts for the events that matter most to your business.
Essential alerts include: access point goes offline, switch port goes down, WAN uplink fails or degrades, VPN tunnel drops, unusual traffic patterns detected, new DHCP server detected on the network (rogue DHCP is a common and disruptive problem), and configuration changes made by unauthorised users. Alerts can be sent via email, pushed to a webhook for integration with tools like Microsoft Teams or Slack, or sent via SMS through integration with third-party services.
One of the most valuable but underused alerting features is the configuration change alert. In multi-administrator environments — common in UK businesses where both internal IT staff and external managed service providers have dashboard access — configuration changes can occasionally conflict or introduce unintended consequences. By enabling alerts for all configuration changes, you maintain a clear audit trail showing who changed what, when, and from which IP address. This is not about blame; it is about maintaining operational awareness and being able to quickly identify the cause of any sudden change in network behaviour.
Proactive Monitoring Benefits
- Problems detected before users notice
- Faster mean time to resolution
- Historical data for trend analysis
- Evidence-based capacity planning
- ISP accountability with real performance data
- Reduced support tickets and complaints
- Better user experience and staff satisfaction
- Compliance evidence for audits
Reactive-Only Approach Risks
- Problems only found when users complain
- Longer resolution times and more impact
- No historical context for troubleshooting
- Capacity problems discovered during crunch time
- No leverage when disputing ISP performance
- Higher support burden on IT team
- Frustrated staff and reduced productivity
- Difficulty demonstrating compliance
Advanced Health Monitoring Features
Meraki Insight (VPN and WAN Analytics)
For businesses with multiple sites connected by Meraki Auto VPN, Meraki Insight provides deep visibility into the performance of your site-to-site connections. It monitors latency, throughput, and loss across each VPN tunnel, helping you identify which links are underperforming and whether the issue is with your local internet connection, the remote site connection, or something in between.
Application Visibility
Meraki classifies and monitors traffic by application, showing you exactly how your bandwidth is being used. You can see that Microsoft Teams is consuming 30% of your bandwidth, web browsing accounts for 25%, and file downloads make up another 20%. This visibility helps you make informed decisions about bandwidth allocation, traffic shaping, and application prioritisation. If Teams calls are suffering, you can use the traffic shaping features to prioritise VoIP and video traffic over less time-sensitive applications.
Environmental Monitoring
Meraki access points include built-in environmental sensors that monitor temperature and humidity. In server rooms or areas with critical equipment, these sensors can alert you to environmental conditions that could damage hardware before any harm occurs. This is a frequently overlooked feature that provides genuine value at no additional cost.
Network Security Health Monitoring
Health monitoring extends beyond performance metrics into the security domain. Meraki provides several security-oriented monitoring capabilities that are particularly relevant for UK businesses operating under GDPR and other regulatory frameworks. The Meraki MX security appliance integrates Advanced Malware Protection (AMP), intrusion detection and prevention (IDS/IPS), and content filtering — all of which feed into the health dashboard and provide real-time visibility into threats targeting your network.
The Security Center within the Meraki dashboard aggregates threat intelligence across your network, showing attempted intrusions, malware detections, blocked URLs, and suspicious traffic patterns. For UK businesses handling sensitive customer data — whether in financial services, healthcare, legal, or professional services — this centralised security view is invaluable for both operational awareness and compliance evidence. The National Cyber Security Centre (NCSC) recommends that UK organisations maintain continuous visibility of their network security posture, and the Meraki security dashboard directly addresses this recommendation.
A particularly powerful feature is the ability to correlate security events with network health data. If a sudden spike in bandwidth consumption coincides with an intrusion detection alert, the dashboard helps you determine whether the traffic is legitimate (perhaps a large file upload) or malicious (a data exfiltration attempt). This correlation capability — linking performance anomalies to security events — transforms the Meraki dashboard from a simple monitoring tool into an integrated security operations platform. For UK SMEs that cannot justify the cost of a dedicated SIEM platform, the Meraki dashboard provides a pragmatic alternative that covers the majority of monitoring and alerting requirements.
According to the UK government Cyber Security Breaches Survey, 50% of UK businesses reported experiencing a cyber attack or security breach in the past twelve months. For organisations using Meraki, the built-in security monitoring provides an immediate uplift in visibility and response capability without requiring additional hardware, software, or specialist staff.
Capacity Planning and Growth Forecasting
One of the most strategically valuable applications of Meraki health monitoring data is capacity planning. By analysing historical trends in bandwidth utilisation, client counts, and application usage, you can forecast when your current infrastructure will reach its limits and plan upgrades proactively rather than reactively.
Consider a practical example. Your Meraki dashboard shows that average bandwidth utilisation on your primary internet link has grown from 45% to 72% over the past twelve months. At this rate of growth, you will reach 90% utilisation — the point at which user experience begins to degrade noticeably — within six to eight months. This insight gives you time to engage with ISPs, negotiate pricing, and schedule an upgrade during a convenient maintenance window rather than scrambling to resolve a capacity crisis that has already impacted your team.
Similarly, wireless client density data helps you plan access point deployments. If a particular area of your office has seen client counts grow from 15 to 35 devices per access point over the past year, you know that adding an additional access point in that zone should be part of your next quarterly infrastructure review. The Meraki dashboard makes this data readily accessible, with trend graphs that show growth patterns clearly and allow you to model future requirements.
For UK businesses experiencing growth — whether through hiring, acquisition, or expanding to new premises — capacity planning based on real monitoring data is dramatically more reliable than the rule-of-thumb estimates that many IT teams still rely upon. A 2025 survey by TechUK found that 62% of UK mid-market businesses experienced at least one significant network capacity incident in the previous year, with the majority attributing the incident to inadequate forward planning. The Meraki dashboard provides the data foundation that prevents these incidents.
Integrating Meraki Monitoring with Business Continuity
For UK businesses that maintain formal business continuity plans — increasingly expected by clients, regulators, and insurers — Meraki health monitoring data plays an important supporting role. Business continuity planning requires documented evidence of infrastructure resilience, failover capabilities, and recovery procedures, all of which the Meraki dashboard can provide.
The WAN health historical data demonstrates your internet failover capability: you can show that when your primary link experienced an outage on a specific date, the Meraki MX automatically failed over to the secondary link within seconds, and users experienced no interruption. The wireless health data shows that your Wi-Fi infrastructure provides redundant coverage, with neighbouring access points automatically increasing power to cover the gap if one unit fails. This documented evidence of resilience is precisely what business continuity auditors and insurance underwriters want to see.
Moreover, the Meraki API allows you to integrate health monitoring data with external business continuity platforms. Several UK managed service providers — Cloudswitched included — use the Meraki API to feed real-time network health data into client-facing dashboards and automated reporting systems. This integration ensures that network health is visible not just to the IT team but to business stakeholders who need to understand infrastructure resilience as part of their risk management responsibilities.
The Financial Conduct Authority and other UK regulators increasingly expect regulated firms to demonstrate operational resilience, including evidence of network monitoring and incident response capabilities. For firms in financial services, insurance, and legal sectors, the Meraki dashboard provides a cost-effective way to meet these expectations without investing in dedicated network operations centre infrastructure.
Best Practices for Meraki Health Monitoring
To get the most from the Meraki health monitoring capabilities, follow these best practices that we have developed through managing hundreds of Meraki networks for UK businesses.
Establish baselines. Before you can identify abnormal behaviour, you need to know what normal looks like. Monitor your network for at least two weeks before setting alert thresholds. This baseline period captures typical usage patterns including daily peaks, weekly variations, and any recurring events.
Review health reports weekly. Schedule 15 minutes every week to review the Meraki dashboard health summaries. Look for trends, not just incidents. A gradually increasing channel utilisation or slowly rising latency are early warning signs that action is needed before performance visibly degrades.
Act on firmware updates. Meraki regularly releases firmware updates that include performance improvements, security patches, and new features. The dashboard shows when updates are available and lets you schedule them for out-of-hours installation. Keeping firmware current is one of the simplest ways to maintain network health.
Use the API for custom monitoring. For businesses with more sophisticated requirements, the Meraki API allows you to extract health data programmatically and integrate it with external monitoring platforms, business intelligence tools, or custom dashboards. This is particularly useful for managed service providers monitoring multiple client networks or for businesses with dedicated IT operations teams.
Document your monitoring playbook. Create a written document that specifies which alerts are configured, who receives them, what the expected response is for each alert type, and when escalation is required. This monitoring playbook ensures consistent response regardless of which team member is on duty, and it provides evidence of your monitoring procedures for compliance audits. Review and update the playbook quarterly, or whenever you make significant changes to your network infrastructure.
Let Cloudswitched Monitor Your Meraki Network
Cloudswitched provides managed monitoring services for Cisco Meraki networks across the United Kingdom. Our team monitors your network around the clock, responds to alerts, optimises performance, and provides monthly health reports — so you can focus on running your business instead of managing your network. Contact us for a free network health assessment.
Summary
Meraki health monitoring is one of the most valuable capabilities of the Meraki platform, yet it remains underutilised by many UK businesses. By taking the time to understand the monitoring tools available, configuring appropriate alerts, establishing performance baselines, and reviewing health data regularly, you can transform your network management from reactive firefighting into proactive optimisation. The result is a faster, more reliable, and more resilient network that supports your business rather than hindering it.
The investment required to implement comprehensive Meraki monitoring is minimal — the tools are already included in your Meraki licence, and the configuration effort amounts to a few hours of focused work. The return on that investment, measured in reduced downtime, faster problem resolution, better user experience, and stronger compliance posture, is substantial and ongoing. For UK businesses that depend on their network for daily operations — which today means virtually every business — proactive monitoring is not a luxury. It is a fundamental operational discipline.
Your staff may never notice the difference — and that is exactly the point. The best network is the one nobody has to think about.

CloudSwitched
London-based managed IT services provider offering support, cloud solutions and cybersecurity for SMEs.


