Every business owner running Google Ads asks the same fundamental question: is this actually making me money? It sounds simple, but accurately measuring the return on your advertising investment is one of the most challenging — and most important — aspects of PPC management. Get it wrong, and you could be pouring thousands of pounds into campaigns that look successful on the surface but are actually losing money. Get it right, and you gain the clarity to scale what works and cut what does not.
This guide walks you through everything you need to know about measuring Google Ads ROI and ROAS, from the fundamental calculations to advanced attribution models, with practical examples relevant to UK businesses.
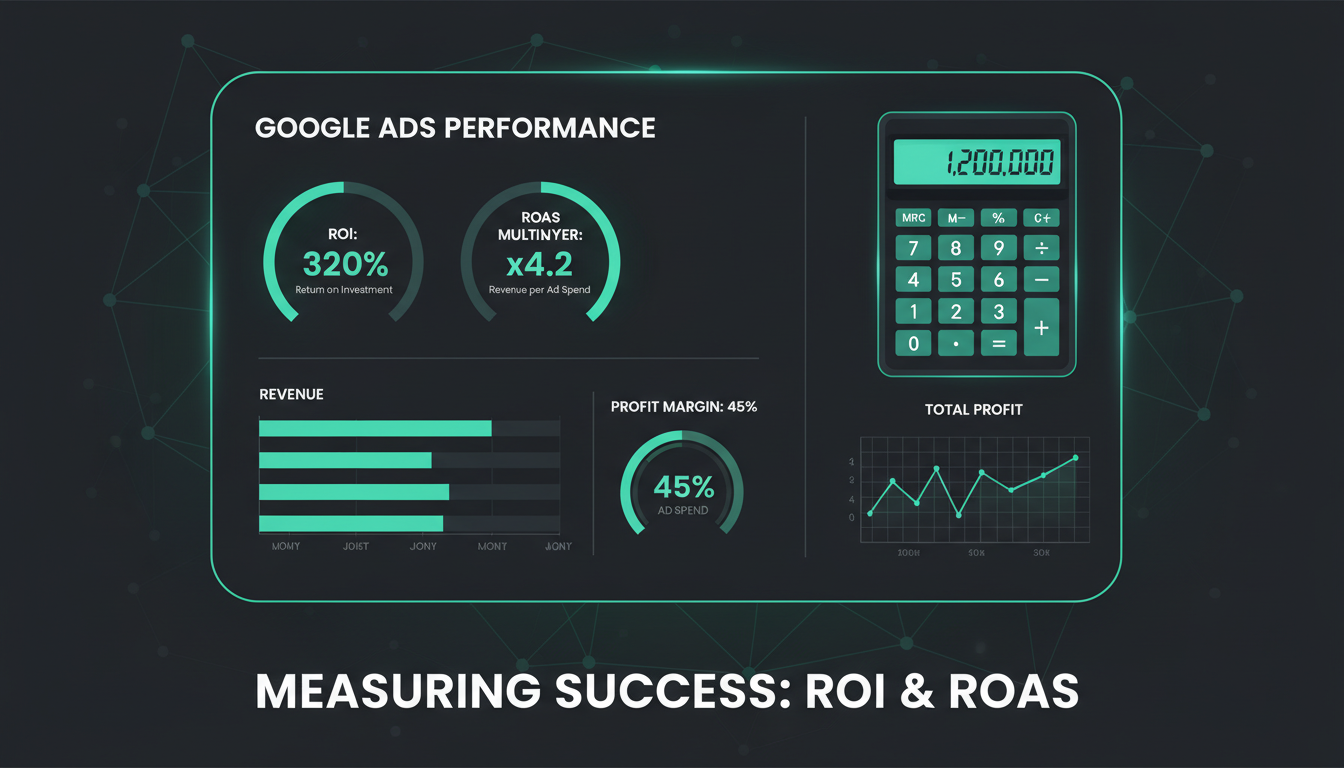
Understanding the Difference: ROI vs ROAS
Before diving into measurement techniques, it is essential to understand the distinction between ROI (Return on Investment) and ROAS (Return on Ad Spend). These terms are frequently used interchangeably, but they measure fundamentally different things, and confusing them leads to flawed decision-making.
ROAS (Return on Ad Spend) measures the gross revenue generated for every pound spent on advertising. The formula is straightforward: Revenue from Ads divided by Cost of Ads. If you spend £1,000 on Google Ads and generate £5,000 in revenue, your ROAS is 5:1, or 500%. ROAS tells you how effectively your ad spend is generating top-line revenue.
ROI (Return on Investment) measures the actual profit generated after accounting for all costs — not just the ad spend, but also the cost of goods sold, fulfilment costs, staff costs, agency fees, software subscriptions, and overheads. The formula is: (Profit from Ads minus Total Costs) divided by Total Costs, multiplied by 100. ROI tells you whether your advertising is actually making you money after everything is accounted for.
ROAS
ROI
A common trap is celebrating a high ROAS without considering profitability. A campaign with a 400% ROAS sounds impressive, but if your product margins are only 20%, you are actually losing money on every sale. Understanding this distinction is the first step towards meaningful measurement.
Setting Up Conversion Tracking Properly
You cannot measure what you do not track. The foundation of all ROI and ROAS measurement is accurate conversion tracking, and this is where a surprising number of UK businesses fall down. We regularly audit Google Ads accounts where conversion tracking is misconfigured, duplicated, or entirely absent.
There are several types of conversions you should be tracking:
Primary conversions are the actions that directly generate revenue or leads. For e-commerce businesses, this is a completed purchase with a transaction value. For service businesses, this might be a form submission, a phone call, or a booking. These are the conversions that your bidding strategies should optimise towards.
Secondary conversions are supporting actions that indicate intent but do not directly generate revenue. Examples include adding a product to a basket, downloading a brochure, watching a video, or visiting a key page such as your pricing or contact page. These should be tracked for observation but not included in your bidding optimisation, as doing so dilutes the signal.
Use Google Tag Manager to implement your conversion tracking rather than adding tags directly to your website code. GTM provides a clean, auditable container for all your tracking tags, makes it easy to test before publishing, and allows non-developers to manage tags without touching the website's source code. It also supports consent mode for UK GDPR compliance.
Phone call tracking is particularly important for UK service businesses. Many businesses spend heavily on Google Ads but have no way of tracking which calls came from which campaigns. Google's built-in call tracking provides basic functionality, but dedicated call tracking platforms like Infinity or Mediahawk offer deeper integration, call recording, and attribution data that ties individual calls back to specific keywords and ad groups.
Calculating ROAS: A Practical Example
Let us work through a realistic example for a UK e-commerce business selling premium pet food online.
In a given month, the business spends £3,500 on Google Ads. The campaigns generate 280 conversions (completed orders) with a total tracked revenue of £18,200. The ROAS calculation is simple: £18,200 divided by £3,500 equals 5.2. For every pound spent on Google Ads, the business generates £5.20 in revenue. Expressed as a percentage, that is a 520% ROAS.
But what does this actually mean for the business? Is it profitable? To answer that, we need to move beyond ROAS and calculate ROI.
Calculating True ROI: The Full Picture
Continuing with our pet food example, here is the full cost breakdown:
Total costs: £8,190 + £3,500 + £2,240 + £750 = £14,680. Net profit: £18,200 - £14,680 = £3,520. True ROI: (£3,520 / £14,680) x 100 = 24%.
So while the ROAS looked impressive at 520%, the actual ROI is 24%. Still profitable, and a decent return, but a very different picture from the one ROAS alone would paint. Now imagine if the product margins were lower, say 30% instead of 55%. The business would be barely breaking even despite a seemingly strong ROAS.
What Is a Good ROAS for UK Businesses?
This is the question every business owner wants answered, and the honest response is: it depends entirely on your margins, your industry, and your business model. There is no universal benchmark.
However, as a general guide based on our experience managing Google Ads for UK businesses across multiple sectors:
The critical point is that your target ROAS should be derived from your business economics, not from industry benchmarks. Calculate your break-even ROAS first — the ROAS at which you neither make nor lose money — and then set your target above it with a comfortable margin.
To calculate your break-even ROAS, use this formula: 1 divided by your average profit margin (as a decimal). If your profit margin after all costs except ad spend is 40%, your break-even ROAS is 1 / 0.40 = 2.5. You need to generate at least £2.50 in revenue for every £1 of ad spend just to break even. Your target ROAS should be meaningfully above this threshold.
Attribution: The Hidden Challenge
Attribution is where ROI measurement becomes genuinely complicated. The question is deceptively simple: which marketing touchpoint deserves credit for a conversion? In practice, customers rarely see one ad and immediately buy. They might click a Google search ad on Monday, visit your site via an organic search on Wednesday, see a remarketing ad on Friday, and finally convert on Saturday via a direct visit.
Which channel gets credit for the sale? The answer depends on your attribution model:
Last-click attribution gives 100% of the credit to the final touchpoint before conversion. This is the default in most reporting and tends to undervalue awareness-stage activity like Search campaigns for generic terms.
First-click attribution gives 100% credit to the first touchpoint. This overvalues initial discovery and ignores the role of remarketing and nurturing in closing the deal.
Data-driven attribution uses machine learning to distribute credit across all touchpoints based on their actual contribution to conversion. This is Google's recommended model and is now available to all advertisers. It provides the most balanced and accurate view of campaign performance.
| Attribution Model | Credit Distribution | Best For |
|---|---|---|
| Last Click | 100% to final touchpoint | Direct response campaigns |
| First Click | 100% to first touchpoint | Evaluating awareness channels |
| Linear | Equal across all touchpoints | Understanding the full journey |
| Time Decay | More credit to recent interactions | Short sales cycles |
| Data-Driven | ML-based dynamic distribution | Most accurate overall measurement |
For most UK businesses, we recommend using data-driven attribution as your primary model, supplemented by looking at assisted conversion reports in Google Analytics to understand the full customer journey. This gives you the most complete picture of how your campaigns work together to drive results.
Beyond Last Click: Understanding the Full Funnel
One of the most common mistakes in Google Ads ROI measurement is evaluating every campaign by the same ROAS target. This ignores the fundamental reality that different campaigns play different roles in the customer journey.
A brand campaign capturing people who search for your company name will always have a high ROAS because those people already know who you are and are likely to convert. A generic campaign targeting broad category terms will have a lower ROAS because it is reaching people at the awareness stage who may need multiple touchpoints before converting.
If you judge both campaigns by the same ROAS target, you will logically divert all budget to brand campaigns and cut generic campaigns. This feels like smart optimisation, but it is actually cannibalising your pipeline. The generic campaigns are feeding the brand campaigns with new prospects. Cut the top of the funnel and the bottom eventually dries up too.
Google research suggests that 15% of all searches are queries Google has never seen before. This means there is always a fresh pool of potential customers searching for solutions you offer, using terms you might not have considered. Broad match campaigns with smart bidding can capture this demand, but their ROAS will always look lower than exact match brand campaigns.
Setting Up Google Analytics 4 for Accurate ROI Tracking
Google Analytics 4 (GA4) is the primary tool for understanding what happens after someone clicks your ad. Properly configured, it provides the data you need to calculate both ROAS and ROI with confidence.
Key configuration steps include:
Link your Google Ads and GA4 accounts. This allows conversion data to flow between platforms, enables audience sharing for remarketing, and provides richer reporting in both tools. It is a one-click setup that many businesses neglect.
Import GA4 conversions into Google Ads. Rather than using Google Ads' own conversion tracking for primary conversions, import your GA4 purchase or lead events into Google Ads. This ensures both platforms are reporting from the same data source, eliminating discrepancies.
Enable enhanced conversions. Enhanced conversions use hashed first-party data (email addresses, phone numbers) to improve conversion attribution accuracy. In a world of declining cookie coverage, enhanced conversions help close the gap between reported conversions and actual conversions.
Set up ecommerce tracking (for online sales). GA4's ecommerce events provide granular transaction data including revenue, product details, and conversion paths. For service businesses, set up lead values based on average customer lifetime value to give your lead generation campaigns meaningful revenue attribution.
Accounting for Customer Lifetime Value
For many UK businesses — particularly those offering services, subscriptions, or repeat-purchase products — measuring ROI based on first-transaction value alone dramatically underestimates the true return. A Google Ads campaign that acquires a customer for £50 who goes on to spend £2,000 over the next three years has a very different ROI than one that acquires a customer for £50 who never buys again.
Customer Lifetime Value (CLV) is the total revenue a customer generates over their entire relationship with your business. Incorporating CLV into your ROI calculations transforms how you evaluate campaign performance and make budget decisions.
To calculate a basic CLV: Average Order Value multiplied by Purchase Frequency multiplied by Average Customer Lifespan. For example, if your average order is £65, customers buy 4 times per year, and remain customers for 3 years, your CLV is £65 x 4 x 3 = £780.
If you know that a typical customer is worth £780, you can afford a much higher cost per acquisition (CPA) than if you are only measuring the first transaction. This insight often unlocks significant growth opportunities — campaigns that looked unprofitable on a first-transaction basis suddenly become highly attractive when CLV is factored in.
Common Pitfalls in Google Ads ROI Measurement
Over years of managing Google Ads for UK businesses, we have identified recurring mistakes that distort ROI measurement:
Counting assisted conversions as direct conversions. If a customer clicks your ad but converts via a different channel later, some tracking setups count this as both a Google Ads conversion and an organic conversion, double-counting the revenue. Ensure your attribution model prevents this.
Ignoring the time lag. For B2B and high-value purchases, the time between first click and conversion can be weeks or months. Judging campaign performance on the same day or even the same week as the spend produces misleadingly low ROAS figures. Use Google Ads' time lag report to understand your typical conversion window.
Forgetting about VAT. UK businesses often report revenue inclusive of VAT but costs exclusive of VAT, which inflates apparent ROAS by 20%. Ensure you are comparing like with like. If your reported revenue includes VAT, strip it out before calculating ROAS. If your ROAS target is based on net revenue, make sure your conversion values are net.
Not accounting for returns and refunds. E-commerce businesses in particular need to adjust their conversion revenue for returns. A headline ROAS of 500% drops significantly when 15% of orders are returned. Import refund data into GA4 to maintain accuracy.
Treating all conversions equally. A micro-conversion like a newsletter signup is not worth the same as a purchase. Weight your conversion values appropriately, or separate them entirely into primary and secondary actions.
Building a Monthly Reporting Framework
Consistent, structured reporting is the key to making ROI data actionable. We recommend a monthly reporting cadence that covers the following:
Top-level metrics: Total spend, total revenue, overall ROAS, overall estimated ROI, cost per acquisition, and conversion rate. These give you the headline picture.
Campaign-level breakdown: ROAS and CPA by campaign, segmented by campaign type (Search, Shopping, Performance Max, Display, Video). This reveals which campaigns are pulling their weight and which are underperforming.
Trend analysis: Month-on-month and year-on-year comparisons. A 400% ROAS this month means nothing without context. Is it improving or declining? Is it seasonal?
Search term analysis: Which actual search queries are driving your conversions? Are you paying for irrelevant terms? Negative keyword hygiene directly impacts ROI.
Landing page performance: Conversion rates by landing page. A campaign with strong click-through rates but poor conversion rates may have an ad targeting problem or a landing page problem. The data will tell you which.
When to Scale and When to Cut
The ultimate purpose of measuring ROI and ROAS is to make better decisions about where to invest your advertising budget. The framework is logical but requires discipline:
Scale campaigns that consistently deliver ROAS above your target threshold and where the market shows capacity for additional volume. Scaling too aggressively can cause diminishing returns as you exhaust high-intent audiences, so increase budgets incrementally (15-20% per week) and monitor performance closely.
Optimise campaigns that show potential but underperform. This might involve refining keyword targeting, improving ad copy, testing new landing pages, adjusting bid strategies, or restructuring ad groups. Give changes two to four weeks to accumulate meaningful data before judging results.
Cut campaigns that consistently deliver ROAS below your break-even threshold and where optimisation efforts have been exhausted. Not every campaign will be a winner, and continuing to fund underperformers drags down your overall return. Redirect that budget to campaigns that are working.
Need Help Measuring Your Google Ads ROI?
Cloudswitched provides transparent, data-driven Google Ads management for UK businesses. We set up proper conversion tracking, build custom reporting dashboards, and optimise campaigns for genuine profitability — not vanity metrics. Book a free PPC audit to find out exactly what your campaigns are delivering.
GET IN TOUCHFrequently Asked Questions
What is the minimum budget needed to measure Google Ads ROI accurately?
There is no fixed minimum, but you need sufficient conversion volume to draw meaningful conclusions. As a rough guide, aim for at least 30 conversions per month per campaign to have statistically significant data. For most UK businesses, this means a minimum monthly spend of £1,000-£2,000, though this varies enormously by industry and CPC.
How long does it take to see a positive ROI from Google Ads?
New accounts typically take two to three months to optimise to their full potential. The machine learning algorithms behind Smart Bidding strategies need conversion data to learn, and the first few weeks are a learning period. Judge ROI performance on a rolling three-month basis rather than week by week.
Should I use ROAS or ROI as my primary metric?
Use ROAS for day-to-day campaign optimisation because it is straightforward to calculate from the data available in Google Ads. Use ROI for strategic business decisions about budget allocation and profitability. Both are essential; they simply answer different questions.
Can I measure ROI for lead generation businesses?
Yes, but it requires assigning a value to each lead based on your average conversion rate from lead to customer and your average customer value. For example, if 10% of leads become customers worth £5,000 each, each lead is worth £500 for ROI calculation purposes. Import this value as your conversion value in Google Ads.
How accurate is Google Ads conversion tracking?
No tracking system is 100% accurate. Cookie restrictions, ad blockers, cross-device journeys, and privacy regulations all create gaps. Enhanced conversions, consent mode, and conversion modelling help close these gaps, but you should expect a 10-20% discrepancy between reported and actual conversions. Track trends rather than obsessing over absolute numbers.

CloudSwitched
London-based managed IT services provider offering support, cloud solutions and cybersecurity for SMEs.


